An experimental bird migration visualization
Time Integrated
Multi-Altitude
Migration Patterns
About the project

The project

The Problem

Every year hundreds of millions of birds migrate to and from their wintering and breeding grounds, often traveling hundreds, if not thousands of kilometers twice a year. Many of these individuals make concentrated movements under the cover of darkness, and often at high altitudes, making it exceedingly difficult to precisely monitor the passage of these animals.

However one tool, radar, has the ability to measure the mass flow of migrants both day and night at a temporal and spatial resolution that cannot be matched by any other monitoring tool. Weather surveillance radars such as those of the EUMETNET/OPERA and NEXRAD networks continually monitor and collect data in real-time, monitoring meteorological phenomena, but also biological scatters (birds, bats, and insects). For this reason radar offers a unique tool for collecting large-scale data on biological movements. However, visualizing these data in a comprehensive manner that facilitates insight acquisition, remains a challenge.

Our contribution

To help tackle this challenge, the European Network for the Radar Surveillance of Animal Movement (ENRAM) organized the Bird Migration Visualization Challenge & Hackathon in March 2015 with the support of the European Cooperation in Science and Technology (COST) programme. We participated and explored a particular approach.

Using radar measures of bioscatter (birds, bats, and insects), algorithms can estimate the density, speed, and direction of migration movement at different altitudes around a radar. By interpolating these data both spatially and temporally, and mapping these geographically in the form of flow lines, a visualization might be obtained that offers insights in the migration patterns when applied to a large-scale dataset. The result is an experimental interactive web-based visualization that dynamically loads data from the given case study served by the CartoDB system.

Results

Examples

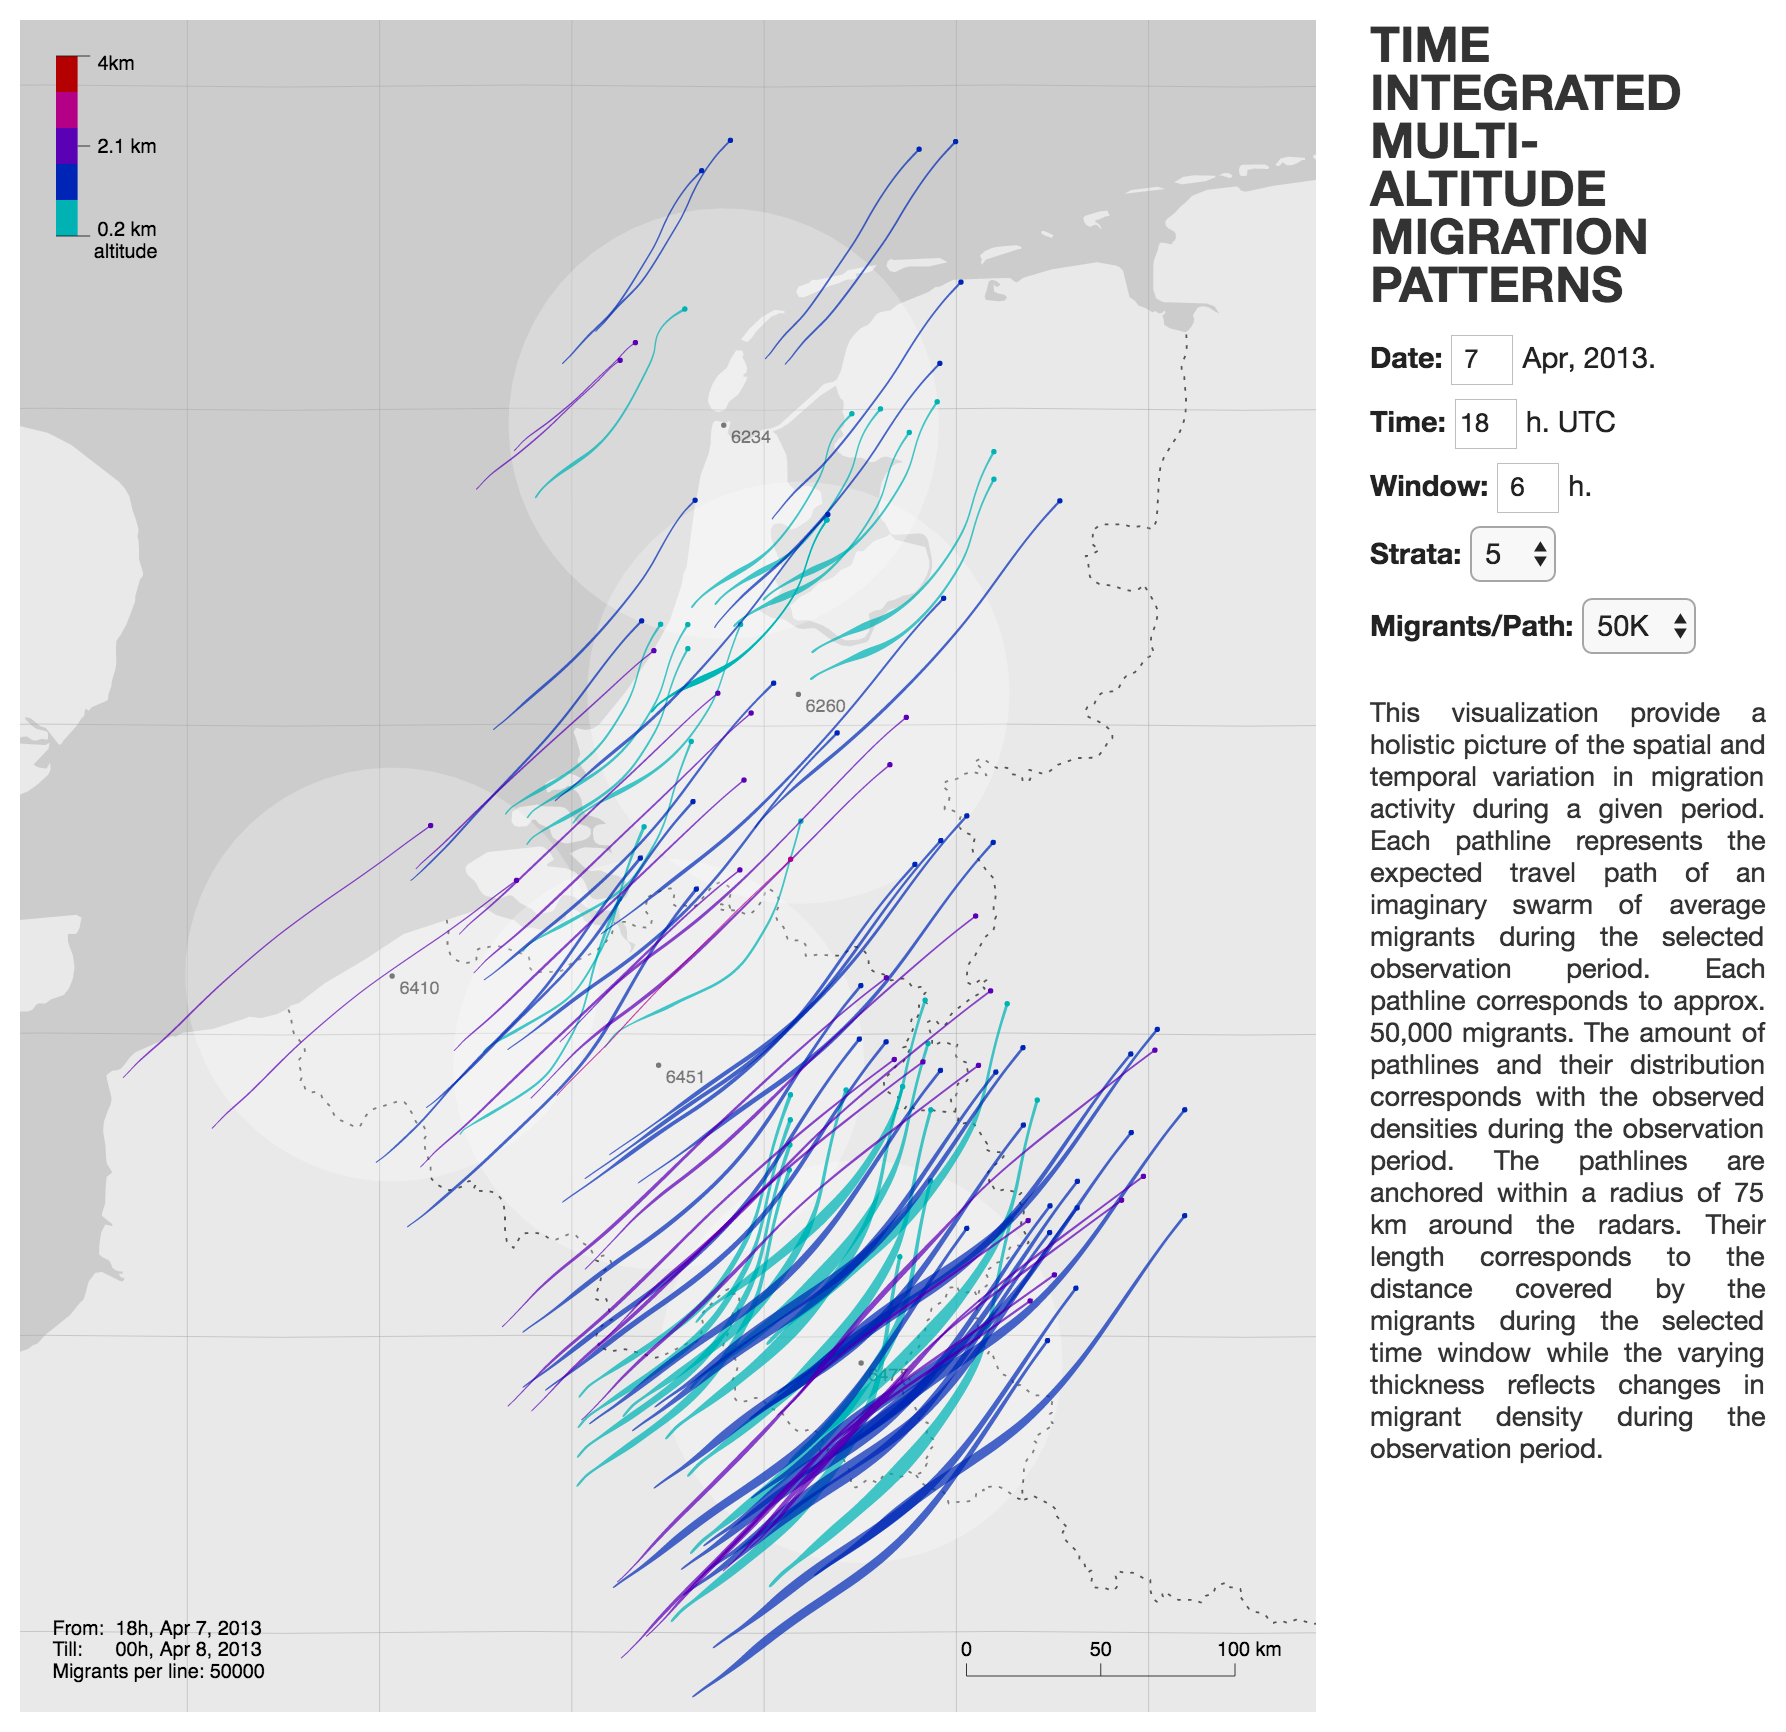
The visualizations utilizes data from five radar locations from The Netherlands and Belgium; Den Helder, De Bilt, Jabbeke, Zaventem, and Wideumont. These visualizations depict general migratory patterns from radar measures interpolated across a sequence of 20-minute time windows. Flow line color indicates height of observation (0.3-3.9 km), density of lines reflects bird density (birds/km3), line length corresponds with ground speed (m/s), and direction of line segments matches the average movement direction (degree).

The flow lines are initialized at random positions within the radar domain (radius 100 km). The amount of lines corresponds linearly to the average density over the full duration of the shown period.

Each flow line consists of a number of segments, one for each time window. The direction of each segment is the average direction observed during the given time window at the given altitude. The length of each section reflects the distance traveled during the time window at the average speed observed during the given time window at the given altitude. Both the speed and the direction are interpolated at the (starting) position of each segment on the map using inverse distance weighting with power 2.

The following examples show the time-integrated flow lines for six consecutive nights for approximately six hours from 21h00 till 3h00 during the spring migration season in 2013.

Night of April 6, 2013, 21h-03h

Night of April 6 2013, 21h-03h

Night of April 7, 2013, 21h-03h

Night of April 7 2013, 21h-03h

Night of April 8, 2013, 21h-03h

Night of April 8 2013, 21h-03h

Night of April 9, 2013, 21h-03h

Night of April 9 2013, 21h-03h

Night of April 10, 2013, 21h-03h

Night of April 10, 2013, 21h-03h

Night of April 11, 2013, 21h-03h

Night of April 10, 2013, 21h-03h

Results

Interactive visualizations

The following interactive visualizations allow you to explore the migration data in the case studies, which covers seven consecutive days during the spring migration season in 2013.

Screenshot of the interactive European Case Study Interface

North-West Europe Case Study (v2)

Screenshot of the interactive USA Case Study Interface

North-East U.S.A. Case Study (v2)

Time Integrated 4-Strata Migration Flows (v1)

Time Integrated Multi-Altitude Migration Flows (v1)

Animated Migration Flows (v1)

Further reading

This project is described in more detail in the following PLOS ONE publication:
Judy Shamoun-Baranes et al., Innovative Visualizations Shed Light on Avian Nocturnal Migration. PLOS ONE, August 24, 2016

The Team

Wouter Van den Broeck

Data & Analytics Research Engineer at imec, BE.

Jan Klaas Van Den Meersche

Web Development Lecturer at Erasmus University College Brussels, BE

Kyle Horton

PhD Student in Ecology and Evolutionary Biology, University of Oklahoma, US

Sérgio Branco

Student in Electrical Engineering, University of Minho, PT

Thanks to:

Judy Shamoun-Baranes and Willem Bouten at University of Amsterdam (NL), Peter Desmet at INBO (BE), Hans van Gasteren and Arie Dekker at Royal Netherlands Air Force (NL), Hidde Leijnse at KNMI (NL), Jose Alves at University of East Anglia (UK), Suzannah Chapman at Rothamsted Research (UK), CartoDB (ES), Kobe Vermeire, Frank Lanssens and Danny Siroyt at Erasmus University College Brussels (BE), Patrik Oosterlynck at INBO (BE) and Klara Verhaert.